The Helping hand in Peak Season: Top 4 important customer journey insights.
Peak season is here, hot and happening now. This time of the year is the busiest in online and offline purchases.

Disclaimer: our analytics have focused online shopping in general. The inspiration- and research stages of the purchase journey are heavily dependent on the specific product categories. Our aim has instead been to understand cultural differences between countries.
Bustling around the internet channels and shopping streets, all sorts of consumers are eager to get their shopping done across the different categories. Learning about the customer journey can help merchants to gain new customers, as well as retain current customers. In this blog we dive into the purchase journey of shoppers, learn about their preferences in different stages of the journey, and what behavior helps consumers to keep track of their own shopping in this intensive shopping period of the year.
Consumers get their inspiration in physical stores and via talking to friends and family
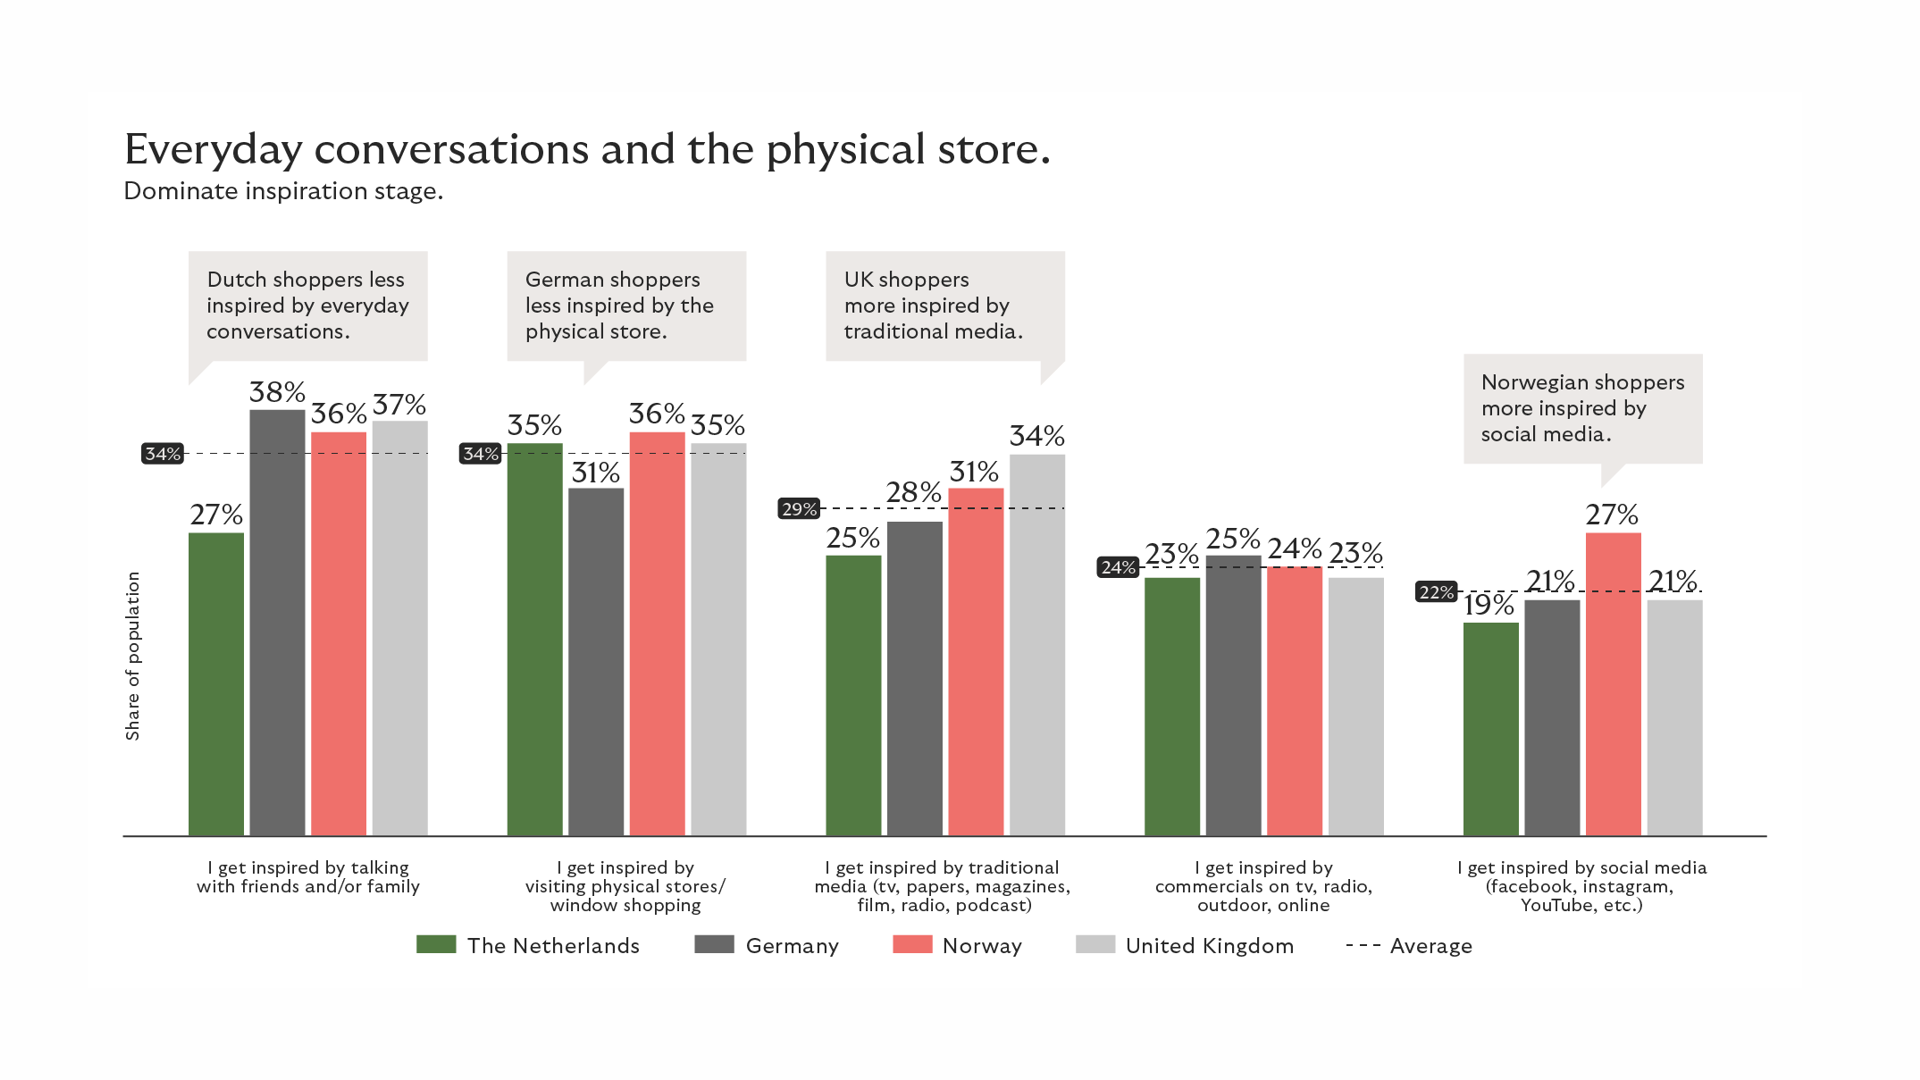
Offline still plays a big part in getting inspired to buy new products and services. Consumers go out and about to garner information and inspiration in brick-and-mortar shops. Looking across all four countries, 34% says friends and family are a much-used source for inspiration, as well as browsing physical stores/window shopping. The third most common inspirational source for shopping online is traditional media, followed by commercials and lastly social media (claimed by 22% of consumers on average).
Dutch consumers claim their primary source of inspiration is browsing physical stores (35%) and a significantly smaller share (27%) state they get inspiration from family/friends. The primary source of inspiration for German consumers is talking with family/friends (38%) followed by browsing physical stores (31%). Norwegian and UK consumers state that they get inspired by both family/friends and physical stores to the same extent. In addition to this, traditional media stand out as an important source of product inspiration for UK consumers. Norwegian consumers get more inspiration from social media compared to the other countries.

Researching and reviewing products is done via different online channels
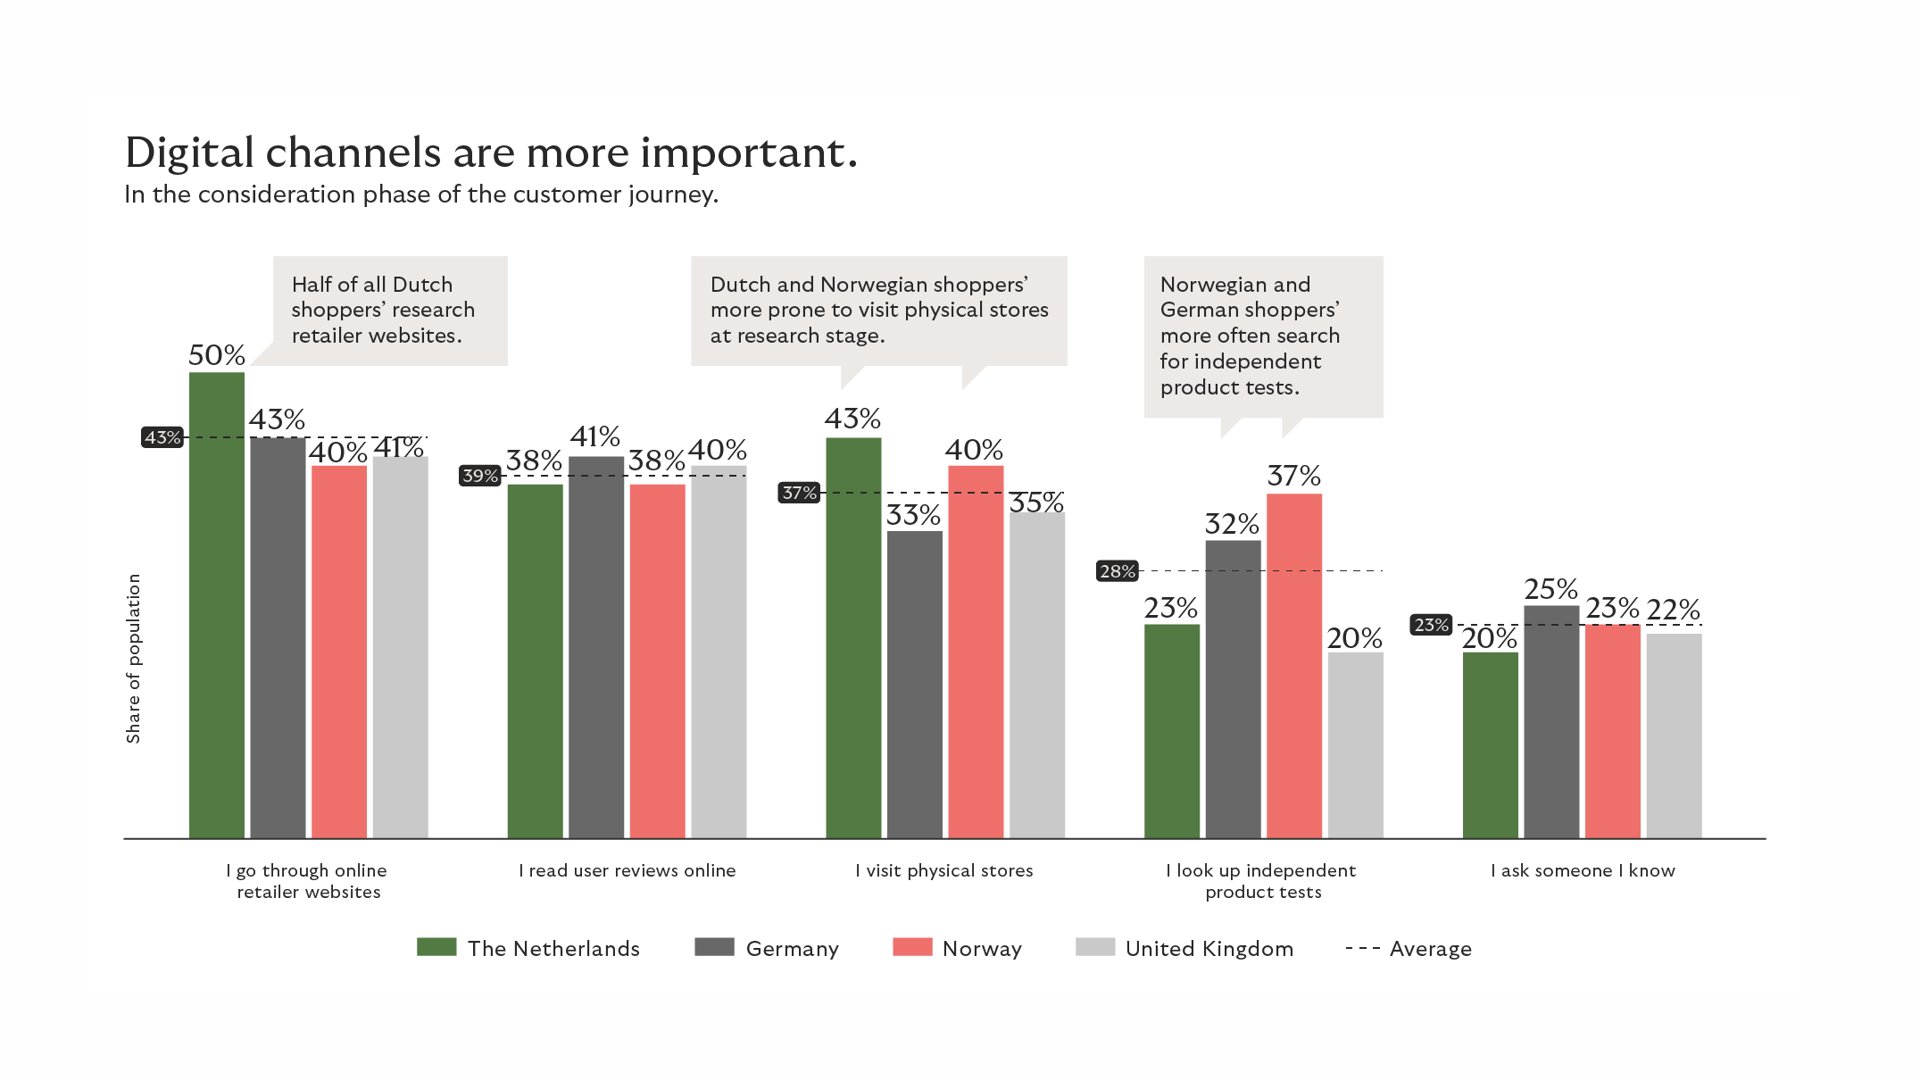
After the physical browsing it is time to dig a little deeper, entering the phase of product research. 43% of consumers across the four countries visit online retailer websites, as their predominant method to research what and where to buy the intended product. Online channels remain dominant as searching for user reviews and visiting physical stores come into second place at almost 4 out of 10 consumers. Only 23% of consumers say asking an acquaintance is their way of researching a product.
However, country differences come into place. Dutch consumers are the most reliant on retailer websites and visiting physical stores. German consumers prioritize not only retailer websites but also user reviews online and independent product tests. And Norwegian consumers are the most prone to look out independent product tests (37%) as opposed to UK consumers where only 20% see this as beneficial to their research.
Online wish lists are popular among young consumers to keep track of shopping
It is not uncommon for consumers to be in different stages of multiple purchase journeys at the same time, we see that 6 of 10 consumers make lists of items that they aim to buy. Shoppers start, add, and alter their lists during online and offline shopping, as well as in their research phases. The practice of noting down shopping lists is most common among Norwegian consumers (67% claim to do this), and it is least common among German consumers where 57% say they keep shopping lists.
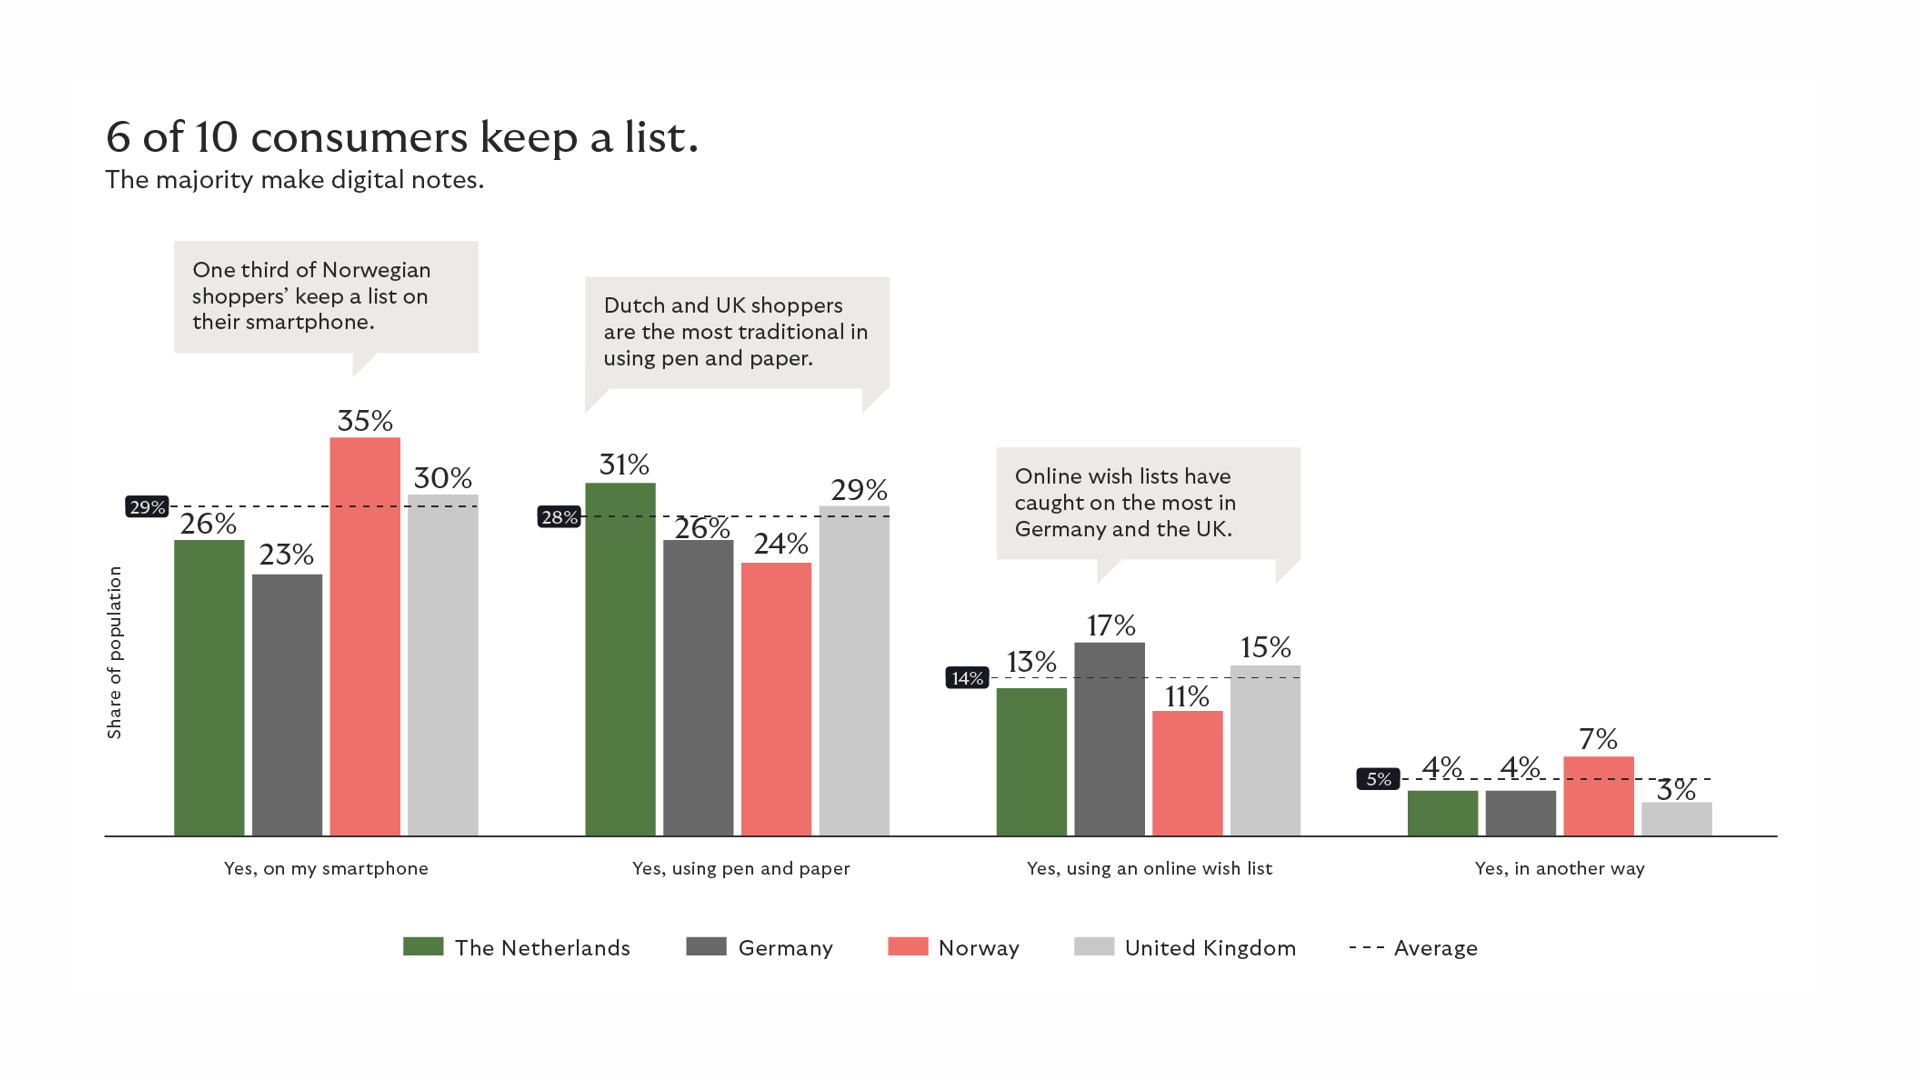
Our data shows that, in general, 77% of young consumers (aged 18-29) keep track of the products that they want to buy, while only 46% of consumers aged 70+ do the same. Consumers mostly do so on their mobile phones (29% of consumers across the Netherlands, Germany, Norway and the United Kingdom) followed by more traditional pen and paper lists (28%).
Norwegian shoppers (35%) use their smartphone to keep a list of what they want to buy more than Dutch and UK shoppers, who prefer to use pen and paper (~30%). Keeping an online wish list either on a merchant website, shopping platform or in an app, for example attracts 14% of shoppers across the four countries. It has caught on the most in Germany and the UK. Youngsters (aged 18-24) use a digital shopping/wishlist the most: 24% keep track of what they want to buy, compared to 6% amongst consumers aged 70+.
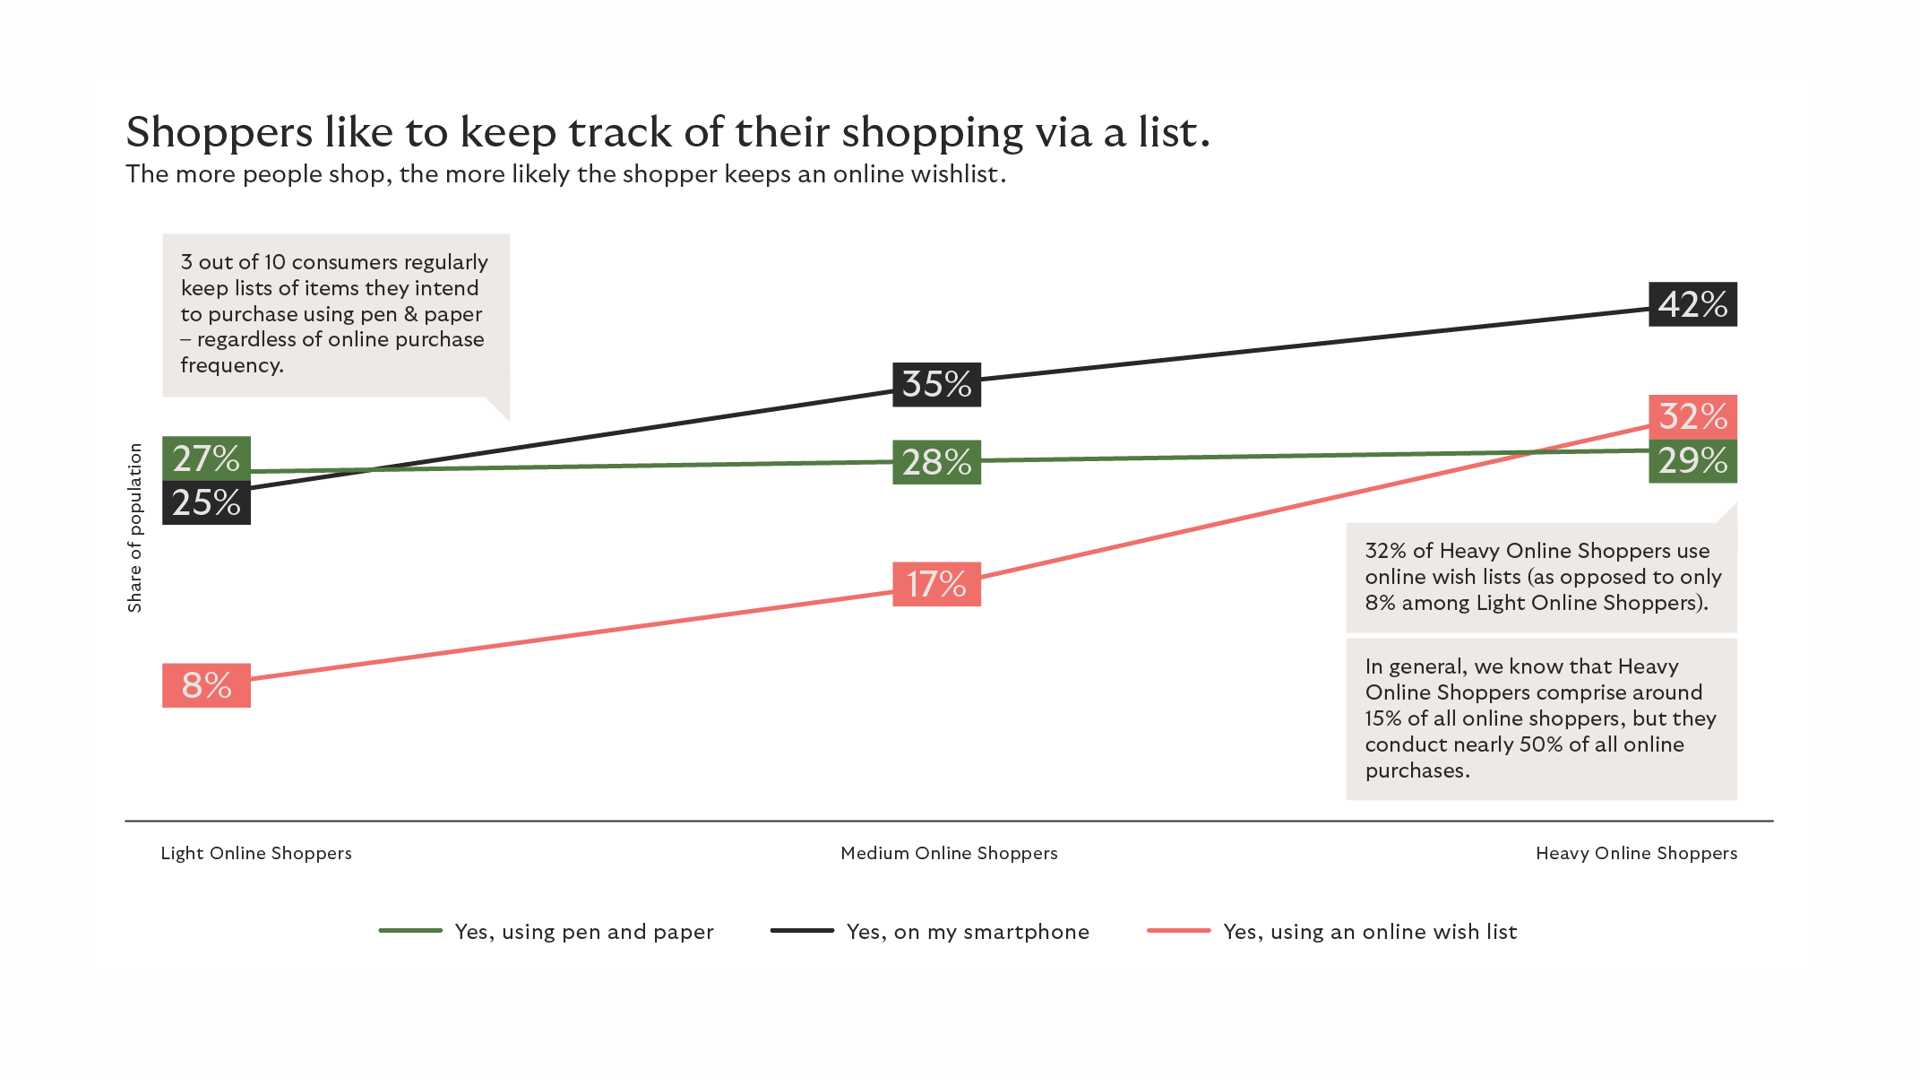
No matter how often a consumer shops online, it is very likely they keep a wishlist. Across all shoppers, a digital list, stored on a smartphone is used most. Online wishlists are rising in popularity. More interestingly: the more people shop and the younger you are in age, the higher the likelihood of using a digital wishlist, either via a merchants webshop or in their app. The use of pen and paper for keeping a list remains stable across Light, Medium, and Heavy Shoppers.
Websites are preferred over applications for making online purchases
After getting inspired offline, online research and creating wishlists, it is time to get ahead and make a purchase. Online shoppers prefer to seal the deal via a website over an app. Across the four countries an average of 35% of online shoppers say they buy via the website. A much lower average of 11% of online shoppers use an app for check out. Norwegians are an outlier here. Only 4% of Norwegian shoppers claim to place an order via an application.
Purchase channel is heavily correlated to consumers’ age. Across countries, we see that 6 of 10 consumers aged 18-29 prefer to purchase online (at website or in app), whereas the online preference in the oldest age band (70+) is only 26%. This is primarily driven by the preference to buy in app, as 22% of the youngest demographic see this as their preferred method of purchase while only 2% of the oldest demographic have the same preference.


