Relevant KPIs for Collections
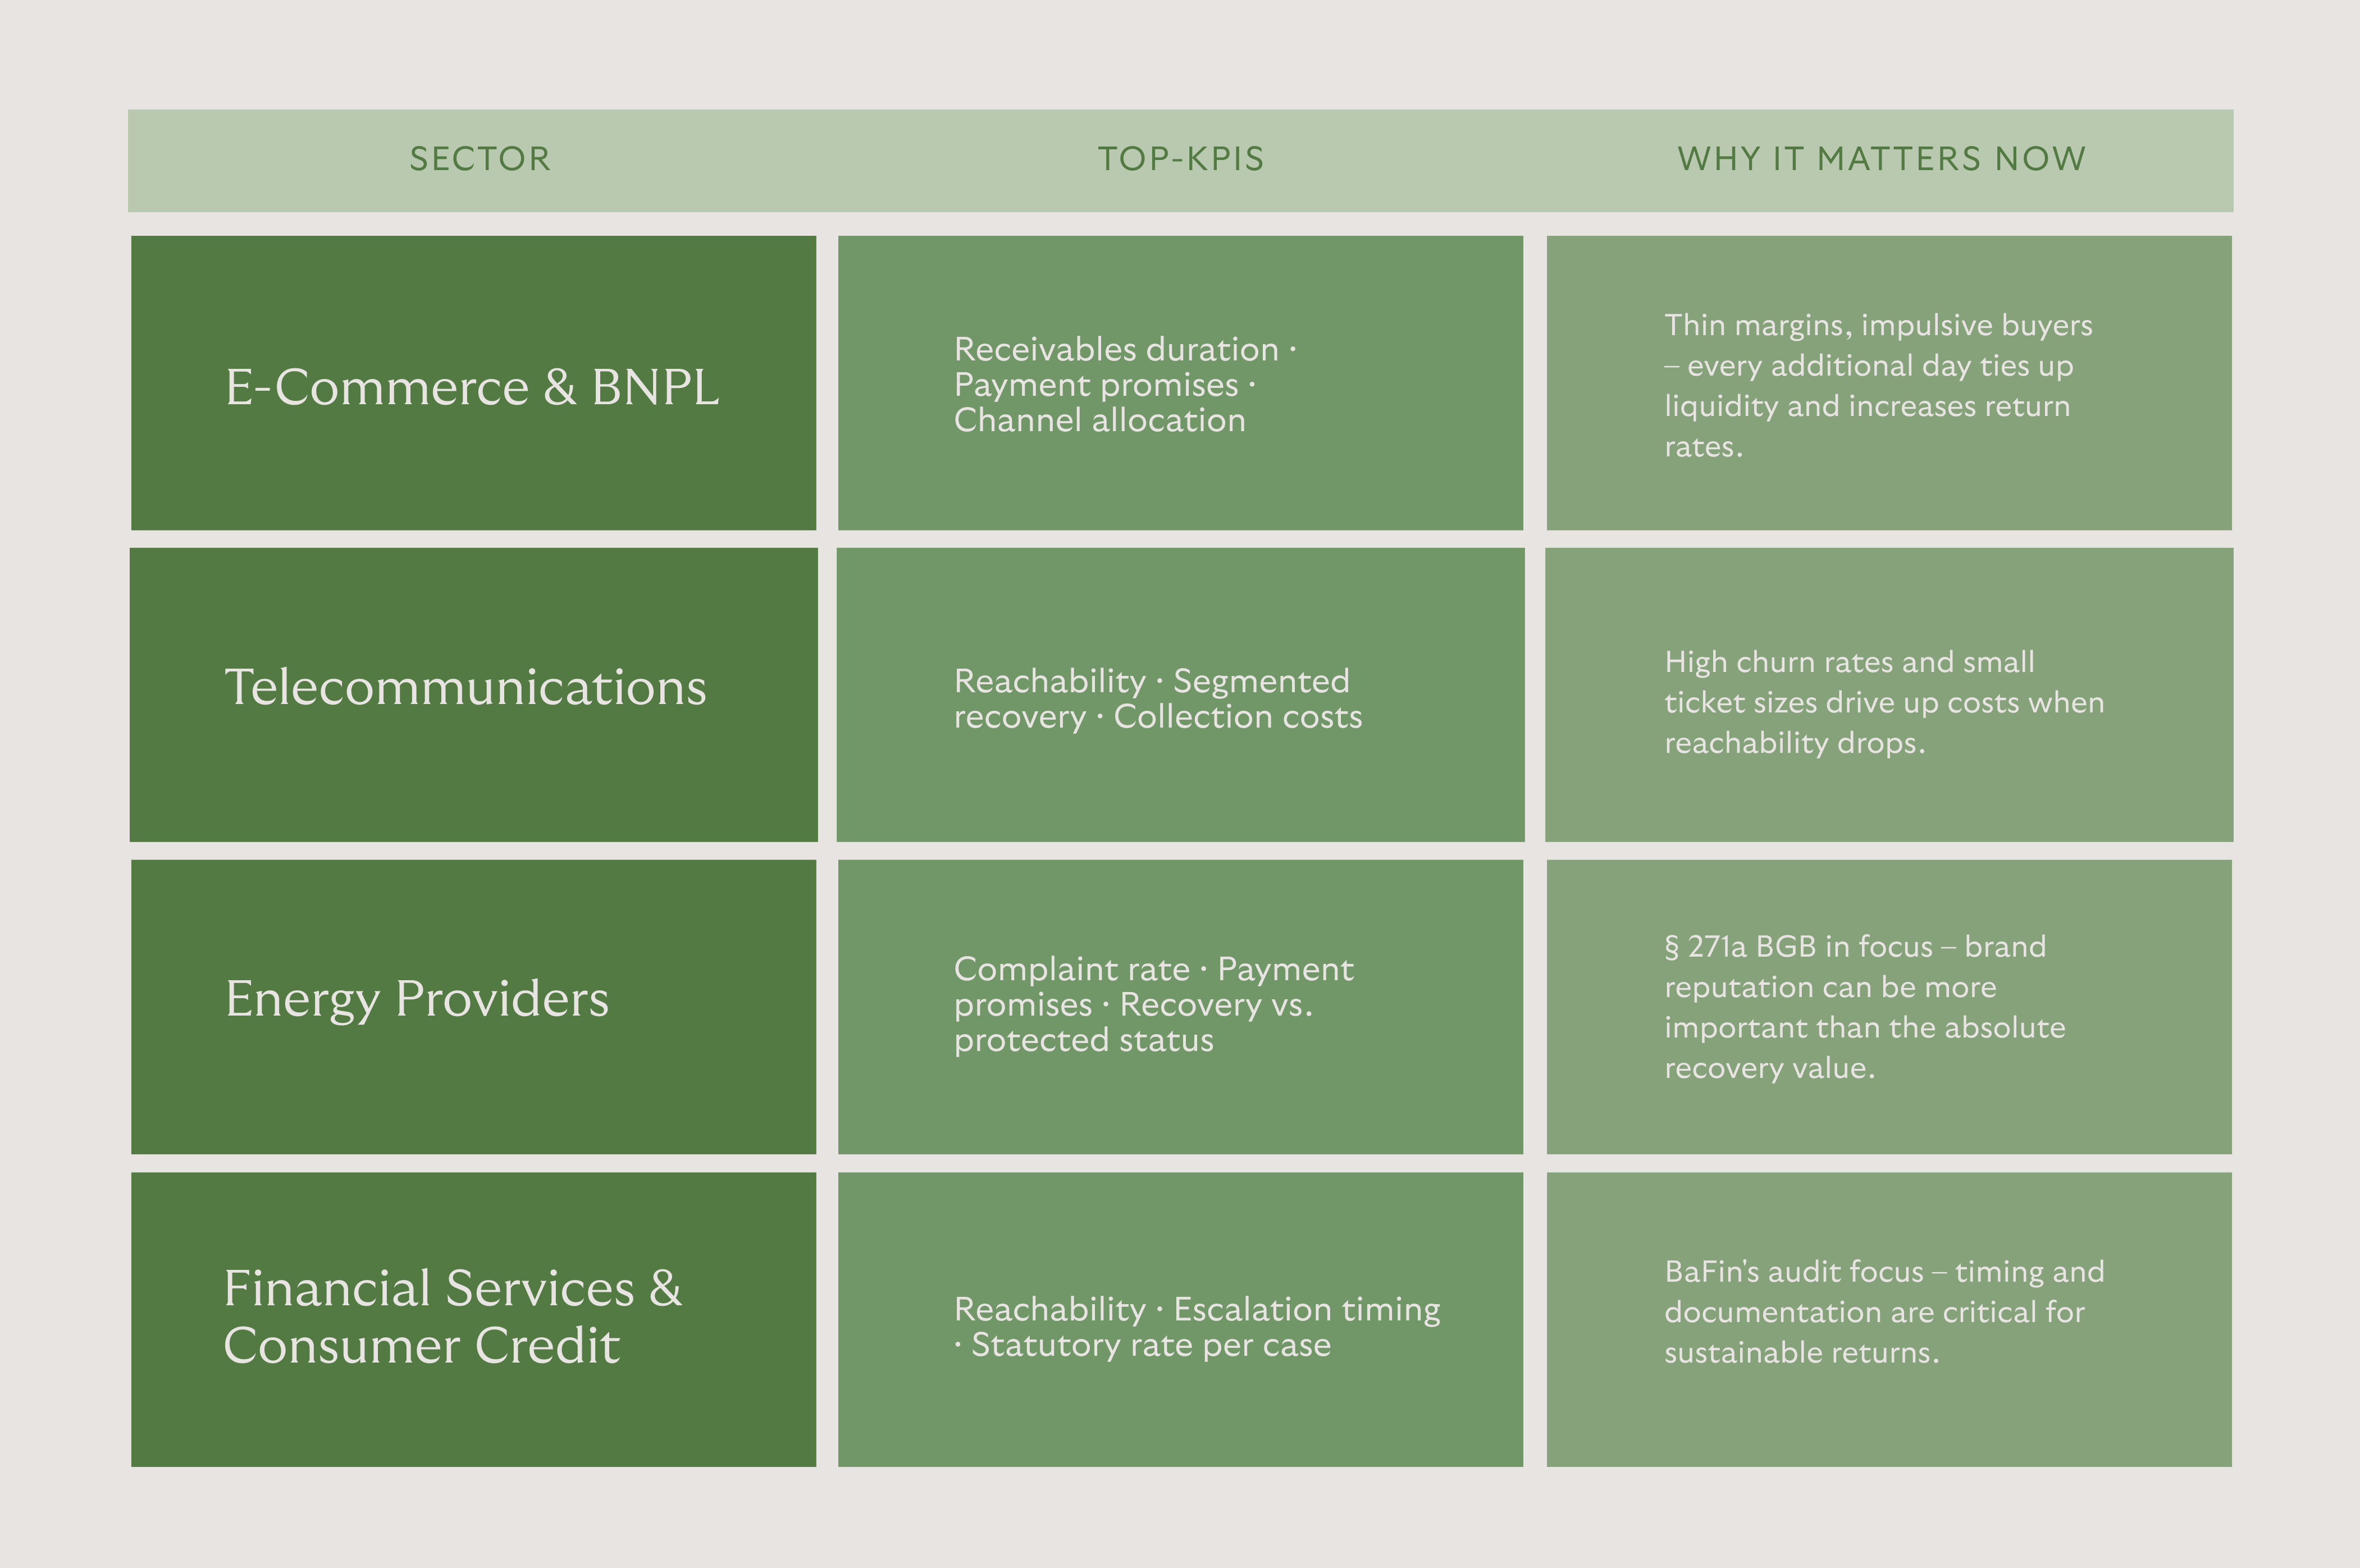
In today's collections landscape, it's not just about what is measured, but how quickly and decisively action is taken. The collections industry is projected to reach over €5.5 billion in revenue by 2025. At the same time, margins are under pressure from regulatory oversight, inflationary payment delays, and consumers demanding digital service even when behind on payments.
To help collections agencies enhance their operations, let's explore some of the key performance indicators to track.
1. Success Rate: How much are you recovering?
The success rate is the most critical metric for measuring the effectiveness of a collections process. There are two primary KPIs to consider:
- Recovery Rate: The percentage of the total amount placed for collections that is actually recovered.
- Realization Rate within X Days (e.g. 30/60/90): Provides insights into consumer willingness to pay and the impact of early actions.
The Recovery Rate tells you how much of the placed debt was successfully collected. Expressed as a percentage, this KPI is especially helpful for:
- Comparing in-house teams vs. external collections partners
- Evaluating return potential on non-performing loan (NPL) transactions
- Benchmarking different debt portfolios (by age, region, risk class)
The Recovery Rate is a lagging indicator, reflecting performance over a longer period. This makes it well-suited for strategic analysis and year-over-year or quarterly comparisons, rather than short-term operational adjustments.
The Realization Rate within X Days (e.g. 30, 60 or 90 days) complements the traditional Recovery Rate by adding a time dimension. It shows how much of the outstanding debt was collected within a defined timeframe. This can reveal the impact of communication strategies, payment incentives, or system changes. Teams can also use this metric to proactively address delays (e.g. late initial contact, improper communication channel).
By closely monitoring these key performance indicators, collections agencies can make data-driven decisions, optimize their processes, and build stronger, more understanding relationships with consumers — all while driving financial success. At Riverty, we're here to support you on that journey, providing the expertise and tools to help your business thrive.
2. Turnaround Time: How quickly are invoices processed?
The speed at which outstanding invoices are resolved directly impacts your liquidity and operational costs. Long turnaround times not only increase the risk of default, but also unnecessarily tie up resources. They can indicate inefficient processes or escalation steps that are triggered too late. By regularly analyzing these key metrics, you can quickly identify areas where processes need to be optimized.
- Average Days to Resolution
- Average Days to First Payment
- First Call Resolution Rate
These metrics can help your teams uncover where bottlenecks occur - is the initial contact too late? Does resolving follow-up inquiries take too long? How do different communication channels impact the process?
An average resolution time of 30-60 days would be considered efficient receivables management. For time from first contact to first payment, 5-15 days is a good benchmark - although it may take a bit longer for B2B matters. Ideally, 30-50% of cases should be resolved on the first call.
3. Contact Rate: Are you reaching the right contacts?
Even the best measures will be ineffective if debtors cannot be reached. The contact rate shows the percentage of people successfully contacted - across all channels. It's a crucial indicator of data quality, channel strategy, and responsiveness. The goal is to achieve the highest possible contact rate with the fewest number of attempts.
Some key metrics to monitor:
- Reach Rate (actually reached individuals)
- Valid Contact Ratio (cases with valid contact data)
- Response Rate by channel (e.g. email, SMS, call)
A low Reach Rate often indicates outdated contact information, unfavorable contact times, or the wrong communication channel. The Valid Contact Ratio provides insights into the accuracy of contact data and signals whether data maintenance requires attention. Response Rates vary by channel - calls typically have the highest, but also require more internal effort. A/B testing can help optimize email outreach and improve results.
4. Process Costs & Productivity: How efficient is your team?
Efficiency in receivables management means maximising recoveries while using as few resources as possible – without compromising on quality, compliance, or customer relationships. Especially in times of high case volumes, growing regulation, and rising personnel costs, streamlined processes are the key to scalability.
Relevant KPIs include:
- Cost per case
- Cases per FTE (average number of cases handled per full-time employee)
- Degree of automation
- Case resolution rate per employee
In the B2C segment, processing costs of around €3 per case are still considered acceptable. In the more complex B2B segment, this figure can rise to €15 per case.
The average number of cases per FTE offers insights into operational efficiency — and may highlight ineffective tools or workflows. A high degree of automation (i.e. the share of process steps completed without manual effort, such as sending reminders or using a self-service portal) is generally desirable. However, this must be considered in conjunction with the success metrics outlined in section 3.
After all, high automation doesn’t automatically lead to higher recovery rates. That’s why efficiency and productivity targets should always be evaluated in the context of actual outcomes. Cost-effective processes only make sense if they also deliver results.


