Take control of your dispute process
Manage all disputes in one centralized hub. Riverty Dispute Management helps you respond faster, track resolution progress in real time, and reduce chargebacks to protect revenue.
What is Riverty Dispute Management?
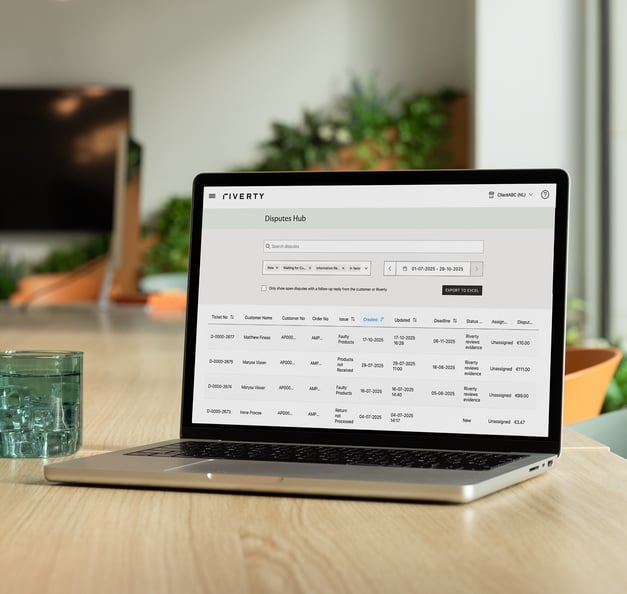
Riverty's Disputes Hub gives merchants a centralized, digital workflow for resolving consumer claims — accessible via the Merchant Portal or email, with optional API and webhook integration.
How it works
Your role in dispute resolution is streamlined and simple
When a dispute is opened:
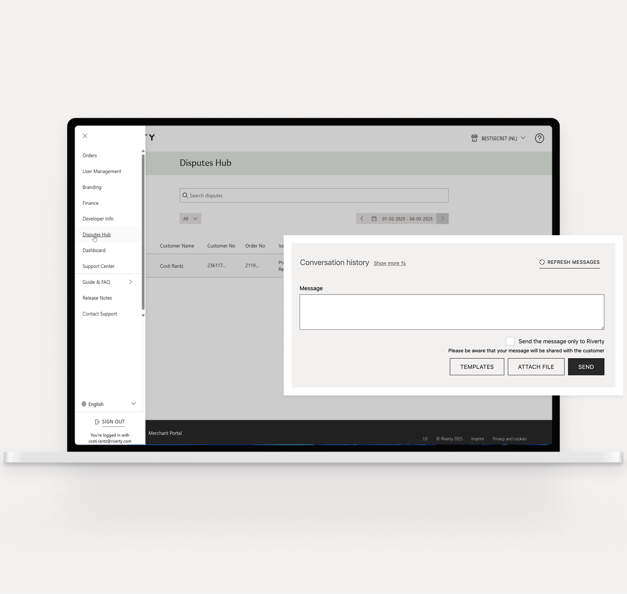
- Respond via Merchant Portal, email or dispute API. Whatever fits your workflow
- Upload up to 5 supporting documents in any common format
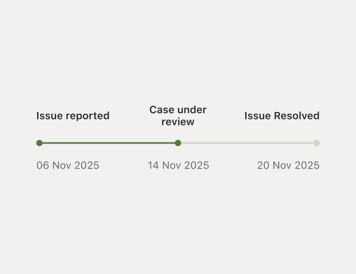
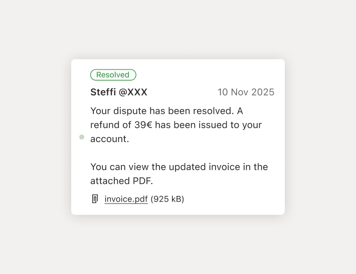
- Track status and communicate in real-time, no lost threads or duplicate work
Ready to streamline your dispute management?

Why It Matters
Revenue protection
Stop revenue leakage from chargebacks. Resolve disputes fairly before they escalate.
Fewer support tickets
Automated updates and transparent status tracking reduce follow-ups from consumers.
Customer trust
Fair, transparent dispute handling turns frustrated customers into loyal ones, even when problems arise.
Actionable insights
See dispute trends by product, reason, and timeframe. Use data to prevent future issues.
Your direct line to us
Our e-commerce payment experts are available to answer all your questions about payment methods. Simply fill out the form to get in touch with us.
Frequently Asked Questions
Riverty Dispute Management is a centralized digital hub that allows merchants to manage all consumer disputes in one place. It helps you respond faster, track resolution progress in real time, and reduce chargebacks to protect revenue. You can access it directly via the Merchant Portal, email, or through optional API and webhook integrations.
Consumer initiates a dispute in the Riverty app and receives confirmation.
Invoice is automatically paused — no manual action required.
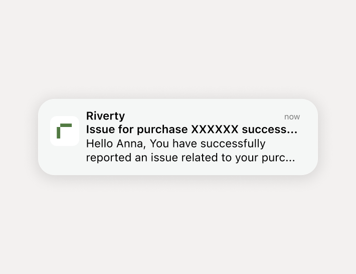
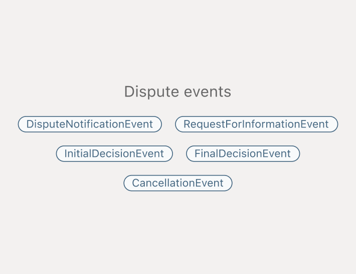
Merchant is notified via email, portal, or webhook.
Merchant responds and collaborates by uploading evidence and communicating with the customer.
Resolution is made by Riverty, who reviews all evidence and either resumes collection or issues a chargeback with clear reasoning.
Centralized view: All disputes, messages, and files in one hub.
Efficiency: Prioritize cases by reason, deadline, or urgency.
Multi-channel access: Manage via email, portal, or API.
Automation: Automatic invoice pausing and notifications.
Insights: Track resolution rates, dispute trends, and chargebacks.
Transparency: All communication is visible to both sides in one thread.
Merchants can respond through the Merchant Portal, email, or API, depending on what fits their workflow best. They can upload up to five supporting documents (PDF, JPG, DOCX, etc.), track dispute progress in real time, and communicate directly with customers—eliminating lost threads or duplicate work.
Riverty offers flexibility, automation, and transparency. Merchants can handle disputes in their preferred channel, appeal outcomes, upload multiple files, and receive proactive notifications. The system helps protect revenue, and builds customer trust through fair, data-driven resolutions.

